Friday, September 23, 2016

Bridge deck drainage is more important than we think: The Cau Cau bridge in Chile

Puente Cau Cau en Chile

The $30-million Cau Cau bridge was supposed to be the first drawbridge in Chile. It is a 90 m long bridge with two decks, each one 45 m long, two traffic lines and one bicycle line. However, in January 2014 when the bridge was finished and ready to be inaugurated, builders realized one small mistake; one traffic deck had been installed upside down.

They realized this error because the bicycle line of one deck ended abruptly and connected directly with the traffic line of the other deck, as shown in the figure 1.

errores  de ingenieria

Figure 1. Bicycle line ends abruptly (Source: Cau cau bridge Youtube video)

The Cau Cau bridge problem

Initially, one may think that this is a minor mistake and could be easily corrected by painting new lines. Actually, by looking at Google Earth images of the bridge, it looks as if they already painted new traffic lines and the bridge looks fine (Figure 2). However, the drainage design of the deck is the main problem and it cannot be solved so easily.

Thus, authorities announced that the bridge would be demolished and a new one would be built. But what is the problem with the deck drainage?


Error en el puente Cau Cau


Figure 2. Aerial view of Cau Cau bridge (Source: from Google Earth)


The Importance of bridge deck drainage

Deck drainage is usually considered a trivial task when building a highway or a bridge. However, it is a very important one and has its own requirements and challenges. In another post we will present an introduction to bridge deck drainage. 

The Cau Cau bridge deck was designed and built with a given longitudinal slope, so that water will flow in one direction (from the middle towards the edge). Such longitudinal slope creates a vertical difference between the two edges of the deck. Thus, there will be a sudden drop at both edges of the deck (Figure 3); besides, the water that was supposed to flow in one direction will flow on the other direction; thus flowing towards a no-outlet edge. 

I do not have the exact details of the designed slope but table 1 shows the vertical difference resulting from some possible longitudinal slopes ranging between 1 per thousand and 1 per cent, assuming a 45 m span. 

If you need  advice on deck drainage or if you have further questions, fell free to contact us.
Table 1. Vertical difference for different longitudinal slopes considering a 45 m span.
Slope [%] Vertical difference [cm]
0.1 4.5
0.2 9.0
0.5 22.5
1.0 45.0
bridge deck drainage
Figure 3. Sudden drop due to longitudinal slope for drainage
The following video from Discovery channel (from Incredible Engineering Blunders) describes this case. This is another example of bridge failure because drainage was underestimated.

Sunday, September 18, 2016

2D flood model preferences

hydraulic modelling 2D

During the last years we witnessed an important increment in the availability of 2D flood models.
As a result, there were many discussions about "which one is the best 2D flood model?".

Personally, I consider that all models that satisfy some benchmarking tests (to verify their accuracy by comparing with some known cases) are good and will provide good results when properly used (adequate selection of cell size, coefficients, boundary conditions). I consider that the main differences between different 2D models are:
  • Computing cost. Some models demand more computing time and use bigger files.
  • Graphical user interface. This is the main difference in any computer program. Software developed by different developers have different GUI. Some are more friendly and some not.
  • User experience. Maybe this one is the most important one. When a user begins to use one model, he becomes familiarized with its interface and its performance. Thus, the users develops an intuitive knowledge about this model and becomes faster at using it.
Poll
This post is a poll about the preferences when selecting a 2D flood model. 10 of the most popular 2D flood models are presented for you to selecte the model that you prefer. The models considered in this survey were selected considering:
  • Their performance was verified considering at least 7 benchmarking tests of the UK Joint Defra Environment Agency (Reference 1, Reference 2).
The models considered in this survey are (they were listed in alphabetical order, no preference):
  • ANUGA: An Open Source Hydrodynamic / Hydraulic Modelling. Most of its components are written in the object-oriented programming language Python. Thus, it is possible to use it via Python scripts.
  • Delft3D: Developed and maintained by Deltares. Although the full potential of this model is for simulating 3D flows, it is also possible to perform 2D simulations by considering one vertical depth averaged layer.
  • Flo-2D: Developed and maintained by Flo-2D software. This model is based on finite elements.
  • Flood modeller pro: One of the most popular models in UK, and during the last years it got a fast growing number of users thanks to the release of a free version. It is the latest update of ISIS.
  • HEC-RAS: Developed and maintained by the USACE. This is one of the most popular hydraulic models. For many years it was limited to 1D flows. However, the HEC-RAS version 5 released in 2015 also includes 2D capabilities.
  • InfoWorks ICM: A very popular model from UK. This model does not only solves the 1D-2D overland flow, but it provides a complete catchment modelling including hydrology and underground drainage sewer systems .
  • ISIS2D: A very popular model in the UK. However, in was replaced by Flood Modeller Pro, which is the latest update of ISIS, and integrates bith the 1D and the 2D.
  • LISFLOOD: Developed and maintained by the University of Bristol. Unlike the other models, this model does not solve hydrodynamic differential equations, but it is based on cellular automata. Thus, it does not require much computing power and the computations are very fast.
  • MIKE21 - MIKE Flood: Developed and maintained by DHI. This is one of the 2D flood models with more cases studies in the world.
  • Sobek 1D2D: Developed and maintained by Deltares. This model was designed specifically for rivers. It was one of the first models to include the hybrid 1D2D capabilities; the main channel simulated as 1D, while the floodplains are simulated as 2D.
  • TELEMAC: Developed and maintained by the TELEMAC-MASCARET consortium. This finite element based model was initially developed by SOGREAH, but in 2010 it was released as a free model by the mentioned consortium
  • TUFLOW: Developed and maintained by BMT WBM. I think that this was the first model that included the nested grid capabilities.
  • XP solutions: It provides a set of models for water resources, drainage and flood hazard. It includes broader scope of tools for including the effects of civil infrastructure.

You can view the current results (percentage of preference) in the following link. Although I have my preference, I will not participate in this poll, as I do not considered it to be fair (I organize the poll). If there is another model that you would like to include in the poll, please let me know (the model needs to verify the benchmarking tests).

Tuesday, September 13, 2016

Scour protection at Akashi Kaikyo bridge

longest bridge Japan World
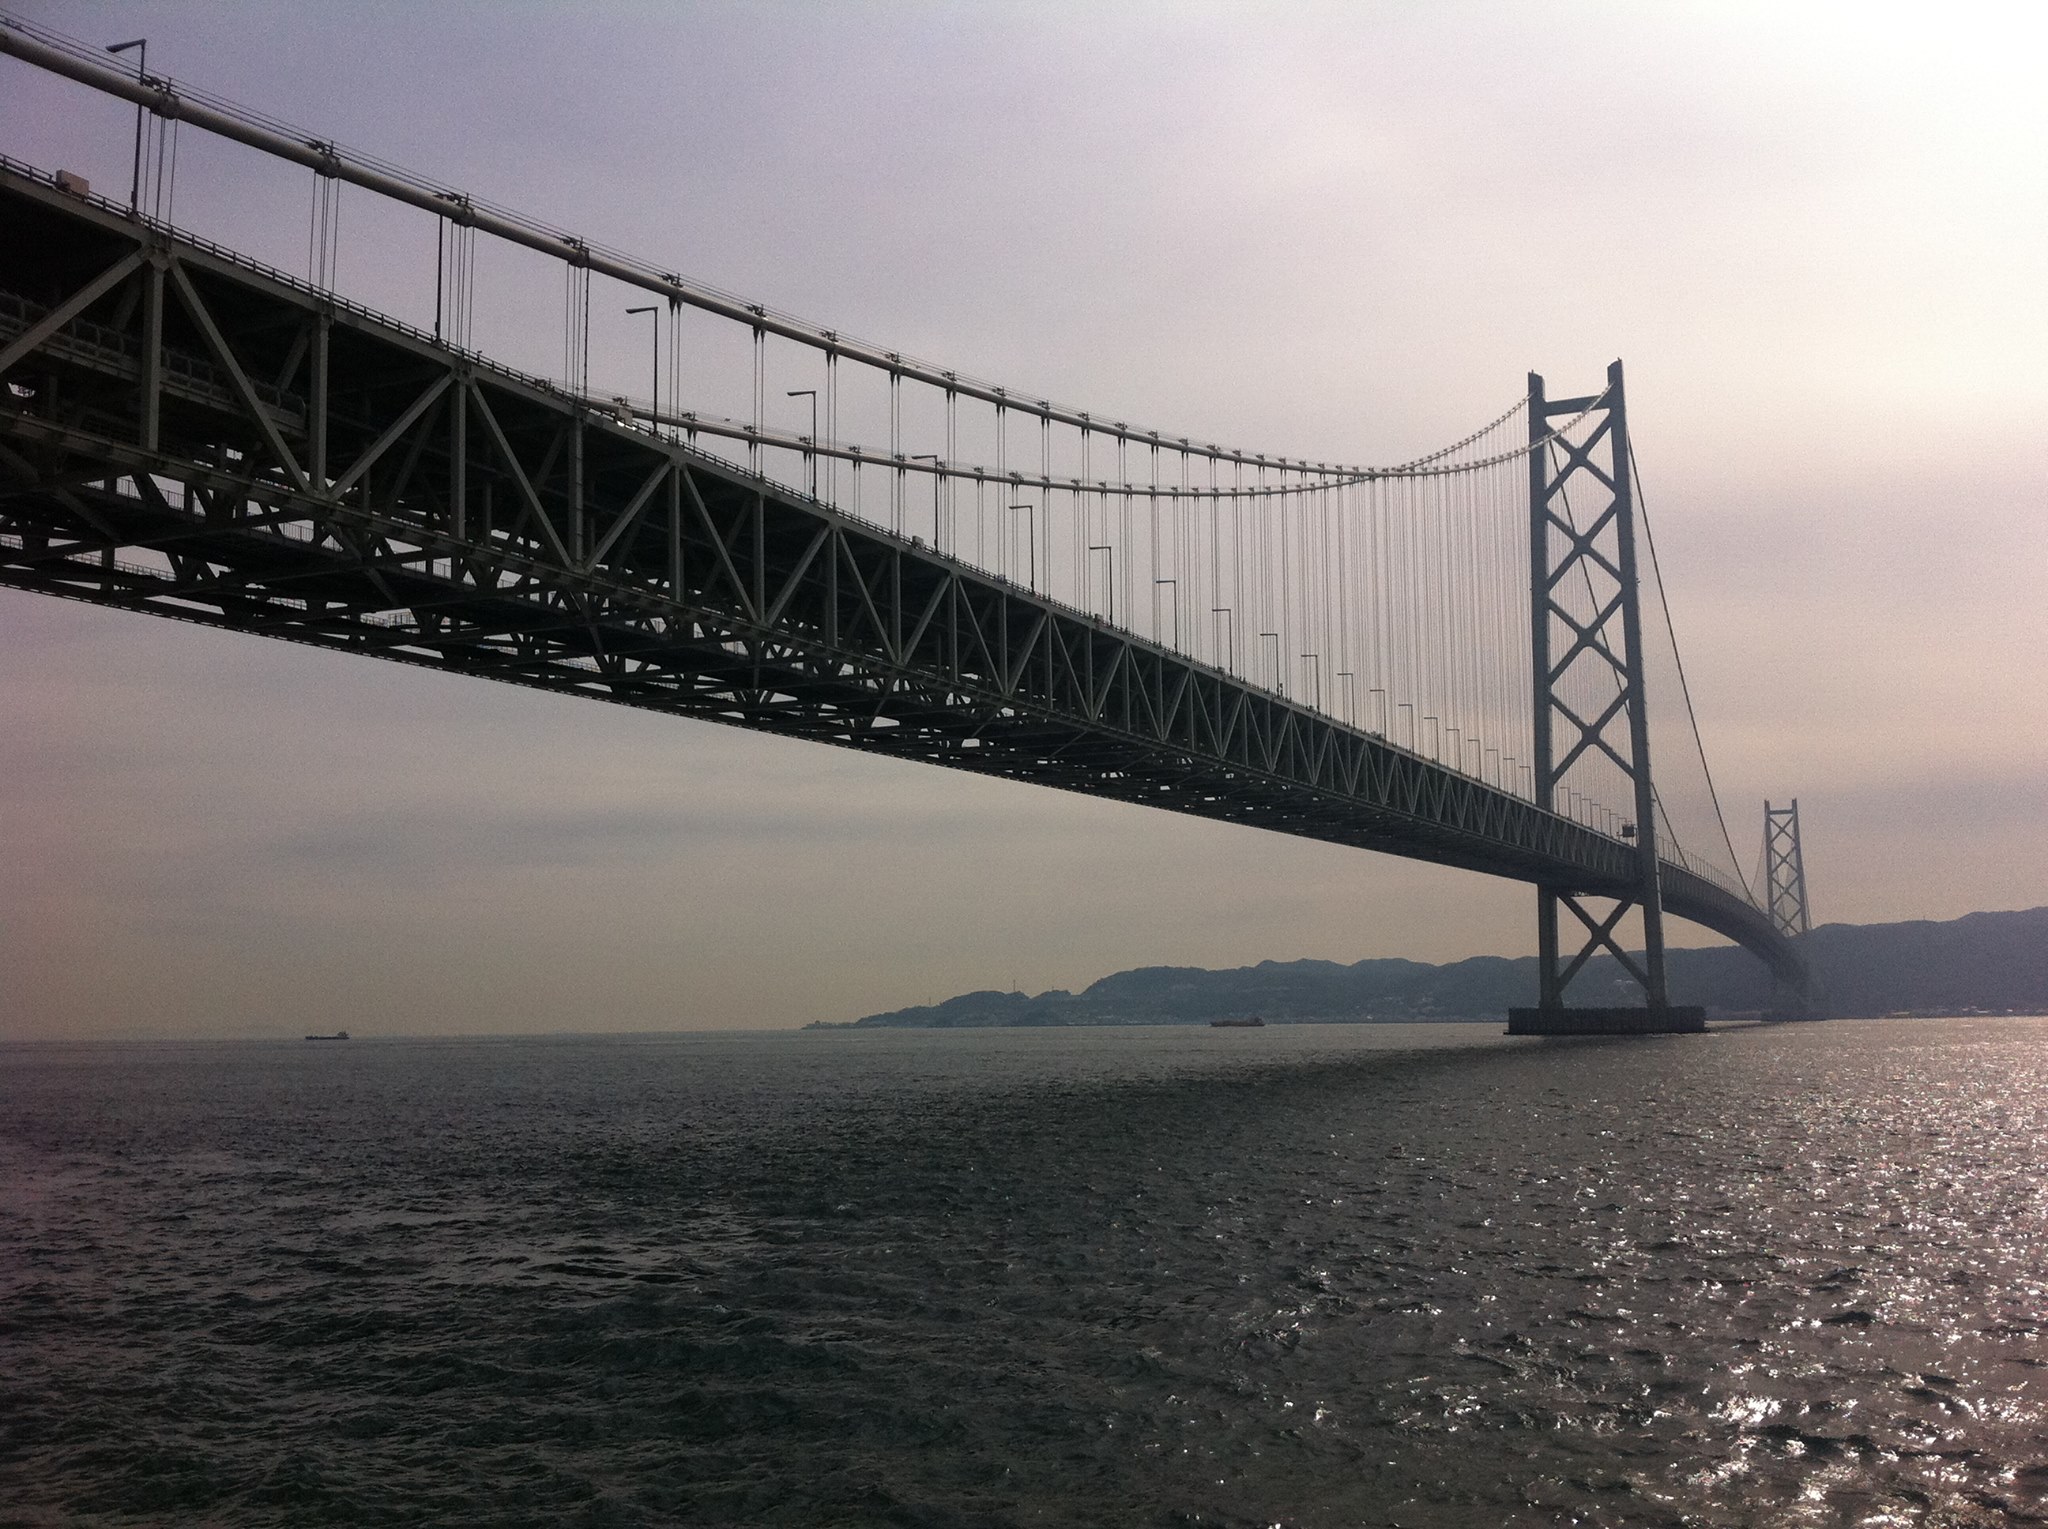
Some years ago, when I was in Kobe I had the opportunity to visit the Akashi Kaikyo or Akashi bridge, the bridge with the longest single span in the world (2 km). While I was looking at the documented experiences of the construction, I realized that the scour at the piers and the innovation in scour protection were among the most important and most challenging tasks.

The heavy load of the superstructure (the volume of concrete cast in each foundation exceeds 200,000 m3, totally amounting to more than 1.4 million m3 as a whole) and the harsh physical conditions of the Strait such as swift tidal currents and its heavy maritime traffic in which more than 1,400 ships navigate a day, made this project a challenge for the civil engineers.

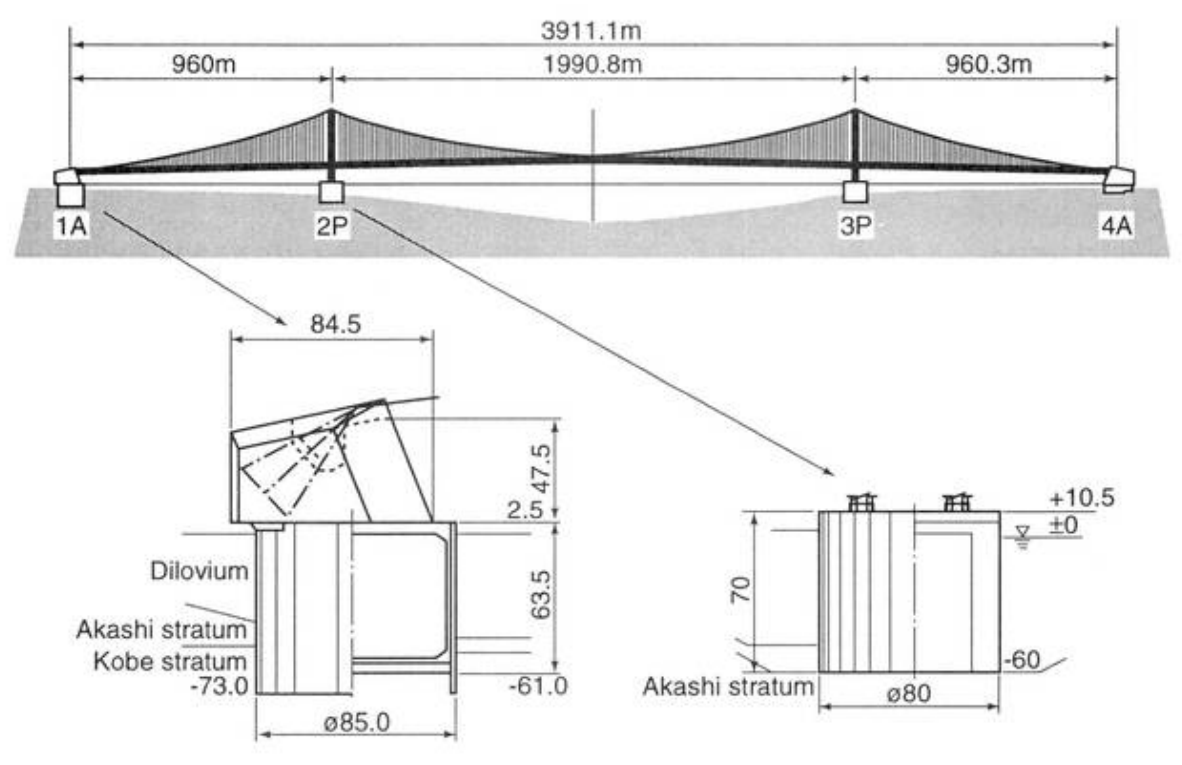
The Akashi Kaikyo Bridge as shown in Figure. 1 is a suspension bridge with a center span of 1,991 m and an overall length of 3,911 m. Foundation work conducted were for 2 anchorages at both ends of the strait and 2 tower foundations on both sides of the navigation lane. Tower foundation located in deep-water zone is a cylindrical shape foundation 80 m in diameter and 70 m high.

After excavating the seabed from 45 m to 60 m below the sea level with a grab bucket dredger, a steel caisson fabricated on a dry dock was installed. Then, scour protection composed of filter units and rip rap was executed in a range of 240 m in diameter around the caisson, and desegregating underwater concrete of 270,000 m3 was deposited in the caisson interior.
suspended bridge puente colgante
Figure 1. Profile of the Akashi Kaiko bridge (Source: Kashima et al., 1998)
Scour protection
The towers are located in an area of strong tidal currents where water velocity exceeds the 7 knots (about 3.6 m/s). When the caisson was installed, accelerated currents (horse shoe eddies) were generated around the caisson and scour began to advance.

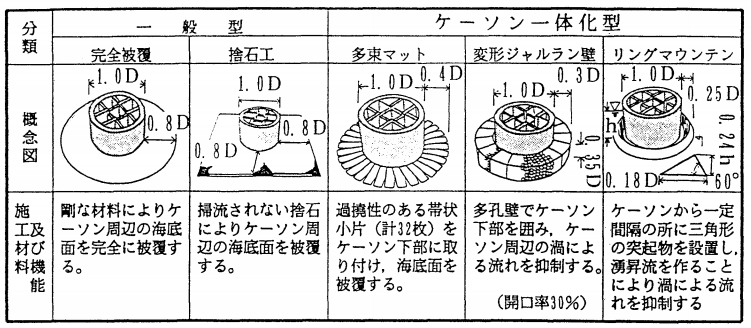
Although the peripheral of the caisson was overlaid with rip raps (1000 kg each), it was confirmed that a sucking phenomenon of ground soil through gaps of rip rap would occur around the caisson. The challenge was to find a way to prevent the scour. Several scour protection measures were analyzed, and a new practical anti-scour filter unit concept was developed (Figure 2).
Akashi-scour pile scour
Figure 2. Scour protection measures considered for Akashi Kaiko (Kitagawa et al., 1991)
The selected measure included the installation of a filtering layer with a thickness of 2 m in a range of 10 m around the caisson. Then, the filter was covered with rip raps of 8 m thick. The filter unit consisted in a netbag weighing 1 metric ton and filled with crushing stones with diameters between 30 mm and 150 mm. Also, a surrounding area of 240 m was covered with rip rap. Then, a continued monitoring/investigation continued for the next 7 years.

After the 7 years period, it was found that scour occurred at the out-most peripheral, but is currently stabilized. Figure 3 shows the caisson without the protection and with the protection.
Akashi-scour2
Figure 3. Caisson without protection (a) and with protection (b) (Source: Kitagawa et al., 1991)

Tuesday, September 6, 2016

Photovoltaic solar farms

Nowadays it is normal to hear about renewable energy. Solar energy is a renewable energy becoming very popular. Moreover, some people even call it “The edge of sunshine”. In this post we will provide a short introduction about solar power.

Figure 1. Solar farm
Source: PV magazine

Solar energy can be captured by thermal systems and photo-voltaic systems. In this post we will introduce photo-voltaic systems. Solar power is based on photo-voltaic, the conversion of light into electricity at the atomic level. When a given material absorbs photons of light, it releases electrons; thus creating an electric current that can be used as electricity. This property of capturing photons and releasing electrons is known as the photoelectric effect.

Figure 2. Photovoltaic system
Source: DitrolicSolar

Sunlight is composed by ultraviolet rays, the visible spectrum rays and infrared rays. All of them are ray lights but with different wavelengths. The so called Solar Constant is the total energy flux outside the Earth’s atmosphere and it is equal to 1367 Watt per sq m. Considering a cross sectional area of the Earth’s surface of 127.4 million sq km, the solar energy flux received by the earth is about 1.7 *10^17  Watt. Thus, in one day the Earth receives more solar energy than the energy consumed by world’s population in 1 year. Unfortunately, not all this energy is converted to electricity. However, in order to estimate the potential solar electricity we have to consider some limitations such as available sunlight hours, angle of incidence, atmospheric absorption and efficiency. 

Astronomical movements
Because of astronomical movements from the Earth, the solar insolation varies constantly. For instance, because of the earth’s rotation no energy can be stored during the night; only daylight hours can be used to store energy. This sunlight hour’s variation is more critical at northern and southern latitudes because of latitude and the Earth’s tilt. During winter season it is normal to have Septentrional and Austral latitudes with several months of only a few sunlight hours (or none).  Besides, it is important to consider that the solar intensity changes within the day. At noon the sun is at its highest point in the sky and the energy reaches the ground perpendicularly. Thus, we have the highest insolation, also known as full sun. This is a very important point for designing solar farms; the inclination given to the panel will define the energy capacity.

Angle of incidence
The optimum angle of incidence is the one that allows a solar panel to be perpendicular to the Sun’s rays. Thus, the whole solar panel will receive energy. Otherwise, when the panels are not perpendicular the effective collecting area decreases according to the non-perpendicular angle. 

Figure 3. Incidence correction]
Source: Solar power

Atmospheric absorption
It is important to consider that the atmosphere is a mass that absorbs energy. Thus, when the light passes throughout the air, some energy is absorbed by the air. Meteorological conditions such as clouds increase the absorption rate. Locations at high altitude have more solar potential because less energy is absorbed by the atmosphere. Thus, it is important to consider meteorological conditions and the elevation of the proposed location for a solar farm.

Efficiency.
Unfortunately, any solar panel and any transformation device has an efficiency far from 100 %. Most of the solar panels have an efficiency between 15% and 22%, depending on the material and manufacturer. Material Science Engineering is performing important research for creating new improved solar panels. Thus, every year the solar panels have higher efficiency and their price tends to reduce.

How many Watts can be produced by solar farms?
The capacity of a solar farm depends on many factors such the geographical location, the size, the number of solar panels and the type of solar panel. Thus, it is not possible to give an average capacity. In this post we provide the capacity of the 5 largest photo-voltaic farms in the world.

Table 1. Top 5 largest photo-voltaic solar farms (Source:Imeche
Solar farm Location Capacity Area
Solar Star California USA 579 MW 13.0 sq km
Desert Sunlight California USA 550 MW 15.4 sq km
Topaz California USA 550 MW 24.6 sq km
Longyangxia Dam Solar Park Qinghai China 320 MW 9.16 sq km
Golmud Solar park Qinghai China 200 MW 5.64 sq km

Further reading: