Monday, December 30, 2013

The new year. What is the new year?

We are at just some hours of the new year; the transition between 2013 and 2014. How many hours? well it depends on where you are. This new year marks that the Earth has complete a complete orbit around the Sun, also known as Julian year. We all know that the time for the Earth to complete an orbit around the Sun is not exactly 365 day, but 365.25 days and the accumulation of the difference creates the leap year. However, most of us do not know that there are other definitions of year, such as sidereal year, tropical year or the lunar year and other years based on certain stars. In the present blog I will just introduce the most common solar years.

Sidereal year
A sidereal year is the time taken by the Earth to orbit the Sun once with respect to the fixed stars. Hence it is also the time taken for the Sun to return to the same position with respect to the fixed stars after apparently travelling once around the ecliptic. It was equal to 365.256363004 SI days at noon 1 January 2000 (J2000.0). This is 6 hours and 9.1626 minutes longer than the standard calendar year of 365 SI days, and 20m24.5128s longer than the mean tropical year at J2000.0. It is important to note that Carl Friedrich Gauss also estimated this year and proposed a duration of 365.2568983 days. Nevertheless, the duration 365.256363004 days was assumed as the standard duration of the sidereal year, while the duration 365.2568983 days was denoted as the Gaussian year. The word "sidereal" is derived from the Latin sidus meaning "star"

Tropical year
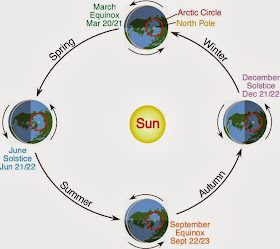
A tropical year (also known as a solar year), for general purposes, is the length of time that the Sun takes to return to the same position in the cycle of seasons, as seen from Earth; for example, the time from vernal equinox to vernal equinox, or from summer solstice to summer solstice. Because of the precession of the equinoxes, the seasonal cycle does not remain exactly synchronized with the position of the Earth in its orbit around the Sun. As a consequence, the tropical year is about 20 minutes shorter than the time it takes Earth to complete one full orbit around the Sun as measured with respect to the fixed stars (the sidereal year).

Image 1. Tropical year of the Earth. Annual change in the position of the Earth around the Sun
References & further reading
The Solar and Sidereal year
Tropical year
Tuesday, October 8, 2013

Self assembling robots

Maybe you remember the T-1000 from the movie Terminator 2: judgment day. Since this terminator made of liquid metal, it was able to take the shape and appearance of anyone or anything it comes in contact with. The same concept of liquid metal was also used in the terminator model T-X from the movie Terminator 3: Rise of the machines. Maybe you remember the scenes when the T-1000 received bullets and then it reshaped to its original, or when it is part of the floor and then shapes to the terminator, or when the T-X reshapes her bubbies. The idea of a robot that automatically reshapes to any shape was great, but seemed impossible.
Image 1. Terminator T-1000 (lefts) and terminator T-X (right)
Image sources: sideshowtoymovieleatherjacket

Recently, the Computer Science and Artificial Intelligence Laboratory (CSAIL) from the MIT gave an important step for such goal. However, they are not using any metal liquid. They developed the so called M-block

The M-Block

The M-Blocks are cubes with no external moving parts. Nonetheless, they’re able to climb over and around one another, leap through the air, roll across the ground, and even move while suspended upside down from metallic surfaces.  

Inside each M-Block is a flywheel that can reach speeds of 20,000 revolutions per minute; when the flywheel is braked, it imparts its angular momentum to the cube. On each edge of an M-Block, and on every face, are cleverly arranged permanent magnets that allow any two cubes to attach to each other. Thus, the M-Blocks may be arranged in any shape

Currently the M-Blocks receive commands via a radio signal. Future research will deal with automating such task. The commands and algorithms will be loaded into each M-Block, so that several hundreds of M-Blocks scattered randomly across the floor will be to identify each other, coalesce, and autonomously transform into a chair, or a ladder, or a desk, or any other shape. The following video shows the M-Blocks and an explanation from the developers.

In this video you can see a more detailed explanation

References & further reading
Surprisingly simple scheme for self-assembling robots
Terminator self-assembling cube robots revealed  by MIT

Sunday, June 30, 2013

Free communication in remote areas using balloons: Project Loon

The idea of using the stratosphere for improving communications was introduced and tested almost a decade ago. The European project Capaninia developed wireless and broadband technologies for use on high altitude platforms (HAP) floating at an altitude around 20 km. HAPs float above aircrafts, but below satellites. Thus, they do not interfere with any device. The main purpose was to provide low cost communications to remote areas.

Some days ago Google announced  its Loon project. Project Loon is a network of balloons that will provide internet and communications to rural and remote areas. The project will fill coverage gaps and bring people back online after disasters. The balloon-balloon and balloon-ground communication are be obtained through radio frequency using ISM bands between  2.4 and 5.8 GHz. Each balloon can provide service to an area up to 40 km diameter, with a speed equivalent to 3G (Image 1).

Image 1. Baloon-balloon and balloon-ground communication
Image Source: Project Loon

How it works?
The balloons are made of polyethylene plastic sheets. Once fully inflated, they are 15 m wide and 12 m high. Each unit is powered by solar panels able to produce up to 100 Watts. Besides, the panels also charge a battery for night use; hence, each unit is able to work the whole day by using only renewable energy.
Each unit also has a box containing the circuit boards that control the system, batteries to operate at night, radio antennas to communicate with other balloons, and the internet antennas to provide the service.

Project Loon takes advantage of the fact that winds in the stratosphere are usually steady and slow, with velocities between  5 and 20 mph. Besides, it is stratified in layers with different wind direction and wind magnitude. Thus, dedicated algorithms determine the required direction of the balloon, so that the balloon will move to the layer with the required wind (Image 2).

Image 2. Balloons navigation according to the wind
Image Source: Project Loon

The following video (Animation 1) summarizes the project and its functioning.


Animation 1. Project Loon
Source: Project Loon

References & Further Reading
Google experiments with internet-bearing baloons
Google's loon project put balloon technology in spotligth
Stratospheric broadbans
The Loon project

Friday, June 14, 2013

Plastic pollution in oceans and also lakes

What is a garbage patch?

All the garbage produced will eventually end up in the oceans and major water bodies. Then, currents will turn it into micro particles and accumulate them into certain areas creating the so called garbage patch.

Plastic pollution poses a big threat to marine ecosystem because it looks like food to fish, birds and other creatures. Some animal eat the plastic, while other get stucked. This garbage is undigestible, and once swallowed it fills the animals stomach creating a fatal blockage.
plastic garbage patch
Image 1. Debris extracted from water bodies

Sunday, June 9, 2013

Passphrase instead of password

A recent study reported that more than 90% of all passwords are vulnerable to being hacked in just seconds. Moreover, the 10 000 most common passwords were published, hence providing access to 98% of all secured accounts. That means that we are prone to being attacked and we must protect our data and our computers.
PC security
Image 1. Source: PCMag

Tuesday, May 14, 2013

Why is gold so valuable?

Gold, like no other metal, has a fascinating history and a special place in the world. For thousands of years it has been used as an ornament of kings, a currency and standard for global currencies, in competitions as symbol of victory and more recently, in a wide range of electronic devices and medical applications. Ancient civilizations used gold for the decoration of tombs and temples.

In modern days, the International Monetary Fund (IFM) and the World Bank (WB) suggested the use of gold as monetary reference, i.e., the value of a bill guarantees a given amount of gold. In sports the winner gets a gold medal. Other example of gold as symbol of power, health and prosperity is the gold mirror fish Mercedes Benz C63 AMG (Image 1). Although there are doubts whether the car is simple paint or real gold paint, it already arose many debates about expending big amount of money on the beautification of such car.

Image 1. gold mirror fish Mercedes Benz
Source: Autoblog

Why is gold so valuable? 

First, it is important to remember some basic concepts about gold. Gold is a dense, soft, shiny, malleable, and ductile metal. It is a chemical element with the symbol Au and atomic number 79. Its symbol is Au. The melting point of gold is 1,948°F (1,064°C) and its Boiling point is 5,173°F (2,856°C). The atomic mass of gold is 196.96657 ± 0.00004 u. The density of gold is 19.30 g cm-3. Some possible reasons for its high value are its unique aesthetic and special properties.

Color and aesthetic
The symbol of gold is Au, from the greek word aurum, which means glow of sunshine. The English word gold comes from the words gulb and ghel referring also to the color. It is the only metal of this color. The gold's characteristic yellow color is due to the arrangement of its electrons. When alloyed with other metals like silver and cooper it has different colors, according to the percentages of the alloy (Image 2).

Image 2. Colors of gold-silver-cuper alloy
Source: ilcomprooro

Physical and chemical properties
Gold has unique physical chemical characteristics that made it very valuable. Gold is the most maleable and ductile of all the metals. One ounce of gold can be drawn into more than 80 Km of thin gold wire. One ounce of gold can be beaten into a sheet covering 9 square meters and 0.000018 cm thick. Gold has an electrical resistivity of 0.022 micro-ohm and a thermal conductivity of 310 W m-1. Hence, it is very efficient for the transmission of heat and electricity. Gold has the highest corrosion resistance of all the metals and it is corroded only by a mixture of nitric and hydrocloric acid. Gold is a noble metal because it does not oxidize.

Scarcity  
The mentioned characteristics are enough to make a very useful and desired metal; thus, a very valuable one. Besides, it is important to consider that gold is rather scarce. It is estimated that the whole gold of the planet equals a total of 168,180 tonnes or 5,407,112,558 ounces. To visualize this volume, let's imagine a single solid gold cube with edges of about 19 meters. This is about three meters shorter than the length of a tennis court.

References and Further Reading
Highest and lowest gold price in history

Sunday, May 12, 2013

New One World Trade Center

On May 10 2013, the spire of the new "One World Trade Center" (OWTC) was installed in New York. The new OWTC has total high of 1776 feet (541 m), which makes it the tallest building in the western hemisphere, and the third tallest building in the world, after the Burj Khalifa and the Shanghai Tower. The total height of 1776 feet is not random, but was selected as a symbolic reference to America's independence. Live cameras allow to follow the construction progress the 24 hours. The present post will introduce some technological innovations about OWTC, which later will be described with more detail.
Image 1. Spire installation of OWTC
Source: inhabitat

Visual
The OWTC is visible from over 20 miles away. The tower rises from a 185-foot (56 m) windowless concrete base, designed to protect it against truck bombs and other ground-level terror threats. From the 20th floor upwards, the square edges of the tower's cubic base are chamfered back, transforming the building into eight isosceles triangles. Visually, the most striking feature of the interior is, without question, the cavernous lobby. Thanks to the boxlike structure of the podium, there is a soaring 60-foot ceiling?think of Radio City Music Hall’s theater, bathed in light.
Image 2. Panoramic view of new OWTC

Safety
OWTC is one of the safest, technologically advanced, and environmentally sensitive buildings in the world. It has a concrete core, with very thick concrete walls. The three-foot concrete slabs are designed to withstand high winds and earthquakes. The podium has some hefty blast-resistant walls at the base, which are state-of-the-art fire-suppression systems. There are 70 specially protected elevators and a separate, dedicated stairway for fire and safety personnel. According to architect Del Valle, "it may not be the tallest building in the world, but it is certainly the safest”.

Green building
OWTC incorporates not only new architectural and safety standards, but new environmental standards as well, setting a new level of social responsibility in urban design. According to the New York Port Authority, the OWTC has already been certified to LEED Gold and will set the global standard for sustainability. Once the building is fully operation, it’s expected to draw as much as 70 percent of its power from green energy. Some other green facts are:

Fuel cells, waste steam recycling, harvest rainwater, landscaping with more than 400 trees, waste material recycling,  use of green cement, renewable wind and hydro power energy, indoor air quality, daylighting, low water bathrooms, green port a potties

References and Further Reading
A look at the new one world trade center
One world trade center spire installed in New York city
One world trade center
One world trade center live cams
Green facts about New York's new one world trade center

Tuesday, April 30, 2013

Earthquakes: Magnitude and Intensity


The last days there have been many news about earthquakes at different locations. However, some of the news mix the concepts of magnitude and intensity. Magnitude and Intensity measure different characteristics of earthquakes.  Just some days ago an introduction about earthquakes was published. The present post will briefly explain the difference between an earthquake intensity and its magnitude.

Magnitude

Magnitude measures the energy released at the source of the earthquake and is determined from measurements on seismographs. It is a quantitative measure of the size of the earthquake at its source. The Richter Magnitude Scale measures the amount of seismic energy released by an earthquake. Richter scale was proposed by Prof. Charles F. Richter. The most important thing to remember about Richter magnitude is that it is a logarithmic scale, meaning that an increase of one in magnitude corresponds to a factor of ten increase in the amplitude of ground motion. Mathematically, an earthquake of magnitude x results in seismic waves with amplitudes proportional to 10^x. Image 1 shows how to get the Richter magnitude of an earthquake by reading a seismogram.

Image 1. Method to get the Richter magnitude of an earthquake.

Intensity


Intensity measures the strength of shaking produced by the earthquake at a certain location. Intensity is determined from effects on people, human structures, and the natural environment. The intensity of an earthquake at a particular locality indicates the violence of earth motion produced there by the earthquake. It is determined from reported effects of the tremor on human beings, furniture, buildings, geological structure, etc.  is variable over the area affected by the earthquake, with high intensities near the epicentre and lower values further away. This phenomenon is the result of seismic-wave attenuation, which is the reduction in wave amplitude and wave energy as they travel away from their source. In order to study the patterns of earthquake intensity during different earthquakes, a system has been devised to assign specific numbers to different levels of shaking. The Mercalli scale was developed in 1902 and modified in the 1930s. The Mercalli scale assigns a numerical value, from Roman numeral I to XII, to the intensity of seismic shaking at any one particular location. Lines of equal intensity (isoseismal lines) are not perfect circles. Image 2 shows the isoseismal of the 1947 Michigan earthquake.

Image 2. Isoseismal of the 1947 Michigan earthquake

A practical example with an everyday life situation may help to understand the concepts. Magnitude can be likened to the power of radio or television waves sent out from a broadcasting station. Intensity is how well you receive the signal, which can depend on your distance from the energy source, the local conditions, and the pathway the signal has to take to reach you.

References and Additional Reading


Thursday, April 25, 2013

Faster than the sound? Our velocity due to Earth's rotation.

We all have heard about relative motion and about relative velocity. "The continuous change of position of a body with respect to a second body or to a reference point that is fixed". 

As the Earth is always moving, we can say that we are always at relative move with respect to a reference fixed point. This post presents a simple estimation of the relative velocity of a person located at the Earth's surface with respect to the rotation axis of the Earth. 


rotation velocity


Monday, April 22, 2013

Earthquakes

April 2013 was marked by unusual high earthquake activity around the world. There were many news about earthquakes at different locations: China, Russia, Mexico and more. There are even articles suggesting explanation a new theories about earthquakes. This post presents a brief introduction about earthquakes. Further posts will provide additional information, such as earthquake magnitude and intensity.

What is an earthquake?
An earthquake is a sudden release of energy in the Earth's crust that creates seismic waves, which in turn shake the ground causing destruction. It happens when two blocks of the earth suddenly slip past one another. The surface where they slip is the fault plane. The location below the earth’s surface where the earthquake starts is the hypocenter, and the location directly above it on the surface of the earth is the epicenter.

There are three main types of earthquakes: Plate tectonics, Intraplate earthquakes and volcanic earthquakes.

Plate tectonics. Earth's crust is broken into tectonic plates which are about 100 Km thick and are constantly moving. An earthquake occurs when the rocks break and move as a result of stresses caused by plate movements. In areas where plates collide, earthquakes can occur down to depths up to 700km. In areas where plates slide past each other, earthquakes are shallower.

Intraplate earthquakes. Intraplate earthquakes are earthquakes that do not occur on plate margins. They are caused by thrust faulting due to the rocks being squeezed or compressed. The movement of the tectonic plates causes the rocks away from their margins to be compressed , generating intraplate earthquakes.

Volcanic earthquakes. Molten rock, i.e., magma, is stored in volcanoes. As this magma moves upwards, it can fracture the rock it squeezes through, causing earthquakes, usually with magnitudes not much greater than 5.0. Sometimes the magma collects in a high level reservoir prior to a volcanic eruption and as it moves around it causes bursts of continuous vibration, called volcanic tremor.

How to detect earthquakes
Erathquakes are detected and measured with seismometers (Image 1). A simple seismometer that is sensitive to up-down motions of the earth can be understood by visualizing a weight hanging on a spring. The spring and weight that are suspended from a frame that moves along with the earth's surface. As the earth moves, the relative motion between the weight and the earth provides a measure of the vertical ground motion. If a recording system is installed, such as a rotating drum attached to the frame, and a pen attached to the mass, this relative motion between the weight and earth can be recorded to produce a history of ground motion, called a seismogram.
Image 1. Seismometer. Image source: Iris

Modern research seismometers are electronic, and instead of using a pen and drum, the relative motion between the weight and the frame generates an electrical voltage that is recorded by a computer. By modifying the arrangement of the spring, weight and frame, seismometers can record motions in all directions.

The Earth's Hazard Program from the USGS has a link reporting earthquackes from all over the world. For intance, in the last 7 days (up to April 23) has 309 reported earthquakes. Moreover, the program also has a real time earthquake map which updates its database every minute.

References and Additional reading

Friday, April 5, 2013

Online GIS for global awareness: Rwanda genocide

It is already 19 years from the Rwandan Genocide and United Nations failure. In this post I will not talk about the international failure about the event; I'd rather prefer to introduce the use of online geographic information systems (GIS) to create global awareness about different topics.

Internet changed the way we communicate and socialize. It allows to intantly share information with the whole world, reaching more people than any other social media. In turn, GIS mapping is an interesting and effective way to engage people in learning about the world, learn geography and study specific issues. Thus, the combination of those two technologies seems a perfect way to share events and create awareness. Different foundations already used those combination for creating awareness about different topics like environment, social justice or climate change.

I consider the crisis in Darfur kml one of the best campaigns to communicate and create awareness about a specific event. Although there are other initiatives to create awareness about genocides, I still have not found any about the Rwandan genocide.

In this post I want to share an online application with some information about such event. The current version contains: Six memorials, three location related to the event and further books and movies about those events and the International Criminal Tribunal for Rwanda

Two online GIS application are included, both with the same information. One using the cloud service from ESRI (GIS frame 1), and the other using Google Earth (GIS frame 2)


View Larger Map
GIS frame 1. Information about Rwandan genocide using the cloud GIS service from ERSI
For better visualization follow the link


GIS frame 2. Information about Rwandan genocide using the cloud GIS service from Google Earth
For better visualization follow the link

References and Further Reading
Geographies of the holocaust
Crisis in Darfur
Global awareness
Shake hands with the devil
Rwanda genocide in ESRI cloud GIS
Rwanda genocide in Google Earth cloud GIS
Hotel Rwanda foundation


Thursday, April 4, 2013

Longer and colder winters because of global warming


We are in April and finally a hot sunny day after a long winter. However, some Northern Hemisphere locations still have cold temperatures. Some people wonder "why the winter was so long if we talk about global warming?". As a matter of fact, global warming may be the reason for longer and colder winters.

Global warming produces more glacier retreat. Although some people wonder whether glaciers retreat faster or slower than predicted, the fact is that they are retreating, as explained in a previous article. Although the Arctic has already reached its maximum yearly extent, such extension is the 6th lowest according to the satellite records.
snow winter holidays christmas
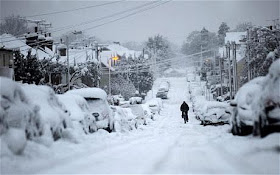
Image 1. Extreme and unusual snowfall in UK
Source: The Telegraph

How does less glacier means colder winter?
An article just published at the "Proceedings of the Academia Science of the United States" shows that Less Arctic sea ice alters atmospheric circulation leading to more snow and ice.

Without a substantial ice cover, Arctic wind is less constrained. Thus, the jet stream of cool air that regulates weather then dips farther and farther south, bringing cold air from the Arctic closer to the Equator. Hence, much colder weather extents into the spring much longer

Besides, Arctic ice locks up water molecules. Once the ice melts, the water molecules change into liquid state, which in turn will evaporate increasing the air moisture. Such moisture will eventually return to earth as precipitation; heavier precipitation than with less moisture. The precipitation may be either rainfall or snowfall. The point is, since there is more precipitation source (air moisture), it is reasonable to expect heavier precipitation.

References and Additional Reading

Tuesday, April 2, 2013

Technologies for detecting antipersonnel mines

Antipersonnel mines are explosive devices designed either to injure or kill humans. They are indiscriminate weapons that injure and kill civilians in every corner of the globe, every day. Moreover, antipersonnel mines do not recognize ceasefires and claim victims long after the end of conflicts. 
The 1997 Mine Ban Treaty, a.k.a. the Ottawa treaty, was signed in the Canadian city of Ottawa. Such treaty aims at eliminating antipersonnel landmines around the world. Nevertheless, there are doubts about its effectiveness, since countries like USA or Russia have not joined the treaty.

Since today is the UN day against mines, this article will  give a brief introduction of how technology contributes for detecting and removing personnel mines.
Image 1. Landmine field
Source: GenevaLunch

The technologies used for detecting landmines may divided into 5 categories: Metal detector technologies, Electromagnetic technologies, Acoustic / seismic technologies, biological technologies and mechanical technologies.

The technologies

Metal detector 
They are cheap and easy to use. They are magnetic sensors that send  current through a wire wrapped around a metal rod or loop, producing a magnetic field that penetrates the ground. Nevertheless, one disadvantage is that all metalic objects are detected. Although more sophisticated metal detectors may detect and see parts of less than 1cm, they cannot be detect new mines made of plastic material.

Electromagnetic
This technology is based on the emission of different radio waves signal into the ground and allow to construct an image of the detected object. Some of the most used electromagnetic technologies are: ground penetrating radar, nuclear quadropole resonance, impedance tomography, microwaves, infrared and ultrasound.

Acoustic / Seismic
This technology vibrates mines by introducing sound or seismic waves into the ground. If there is a material with different properties it will vibrate at different amplitude. The main disadvantage of this technology is that ground depth attenuates the resonant response. Besides, vegetation may interfere with the vibrometers.

Biological
The most common biological method is based on tranined animals that detect the smell of landmines buried into the ground. Although the most common animals are dogs and rats, new researchers have demonstrated that bees could search a large mined area in relatively short time.

A new biological methods consist of engineered bacterias that have certain characteristics when grown near a mine. The method would involve spraying bacteria on a mine affected area, and allow them to grow for several hours.

Mechanical
This method may be divided into probes and clearing machines. Probes are devices with a rigid metal stick that slowly penetrates the ground. When it detects an unusual object, it assesses the contour of the object in order to define whether it is a mine or not. The main disadvantage, is that it is an expensive method.  Mine clearing machines are used to clear a safe path over a mine field. It is basically a machine that detonates the mines. This is a quick and effective method, and the most important, it is riskless  Nevertheless, it basically destroys the field.

In 1996 the german humanitarian foundation "Menschen Gegen Minen" (MGM) (People against mines) was created. This organization not only removes mines, but also develops new and innovative mine detection machines. One of such machines is the MGM rotar.

The MGM ROTAR
The MGM ROTAR is based on idea of a relative lightly armoured system that could easily and safely remove the top soil, followed by a subsequent inspection.

The MGM ROTAR (Image 2) picks up mine infested soil with its rotating sieving drum. While sieving out the soil, objects with a diameter greater than the grid-size get left behind. The grid can be sized so that these objects including all known mine types. Should the mines detonate during the sieving process there is no danger to  the driver or the vehicle. Extremely strong steel and armoured glass protect the operator from the explosion and any fragments. The mines and pieces of unexploited ammunition that do not detonate as the ROTAR spins are dealt with safely later in a specially developed disposal system.

Image 2. MGM ROTAR

Thechnology and science provided us with several alternative to detect and remove antipersonnel mines. Howerver, removing aintipersonnel mines is just the first step. It is up to us, to have the will and the compromise, so that this threaten to life will never happen again.

References and Further Reading:
Menschen Gegen  Minen (People Against Mines)
The MGM ROTAR system, a new path for humanitarian demining
International Campaign to Ban Mines
UN Office for Dissarmament Affairs
A Review of Sensing Technologies for Landmine Detection: Unmanned Vehicle Based Approach 


Thursday, March 28, 2013

Auroras: What are they? When to watch them?

Some days ago, National Geographic published amazing photos of a ghostly green aurora borealis over Iceland (Image 1 and Image 2). Not only I wanted to share those images, but also to provide some information about auroras and how to plan a trip to watch them. A previous article about solar wind could be an introduction about such phenomena.
Image 1. Aurora Borealis in the late night skies above the frozen lake Kleifarvatn in Iceland on March 17, 2013.

Wednesday, March 27, 2013

Modelling Mars Hydrology?

The interest about water and waterpaths in the red planet is quite old. In the late 19th century the Italian astronomer Giovanni Schiaparelli published a map of mars which looked like a river delta with several islands (Image 1). During the first decade of the 20th century the American astronomer Percival Lowell published books and maps with a detailed description of what he termed the "non-natural features". Lowell's channels were more like a network of artifitial adduction channels (Image 2). Such publications popularized the belief that these markings showed that Mars sustained intelligent life forms. Later studies showed that such channels were product of optical illusions due to technical limitations of the equipment of that time.
Image 1. Martian channels reported by Schiaparelli (left) and Lowell (right)
Source: Martian canal Wiki

Nevertheless, some years ago satellite missions revealed evidence of water in the form of river beds, geological forms that are typically formed from large amounts of water and frozen water (i.e., ice) in the martian poles.

Last March 7 2013, a team of scientists published a 3D reconstruction of buried flood channels in the Marte Vallis system, located in the Elysum Planitia. Using the Shallow Radar (SHARAD) sounder on the Mars Reconnaissance Orbiter, scientists were able to produce a tomographic visualization of the buried Marte Vallis channels. The SHARAD data revealed a complex channel system consisting of a broad ~40 km wide main channel that is adjacent to a raised bench, 120 km in width and incised by anastomosing channels formed around four streamlined islands. The main channel has an estimated depth between 69 - 113 m, which is comparable to the depth of the largest megaflood event on Earth. Such channels may have been generated by an ancient mega-flood event due to the release of groundwater.
Image 2. 3D visualization of the buried Marte Vallis channels beneath the Martian surface
Source: livescience

Scientists are now studying the source and scale of the channels, in order to comprehend Martian hydrologic activity and determine whether such floods could be related climate change on our planetary neighbour. Topographic data is already available, along with estimation of water volume. Now, I Wonder if it is reasonable to imagine that future studies will probably apply hydrologic and hydraulic modelling techniques in order to understand the past hydrological events that happened in the red planet. Will it possible to apply current modelling software, e.g. HMS, MODFLOW or RAS, to Mars? Which modifications would be required? Maybe the lower gravity would induce modifications to some parameters such as different manning or Froude number. Anyway, I think it opens a new door of opportunities for hydrological and planetary sciences

References & Additional Reading
3D Reconstruction of the Source and Scale of Buried Young Flood Channels on Mars
Ancient Mega-Flood on Mars Revealed in 3D
Could massive floods on Mars have caused climate change? New 3D maps suggest the red planet suffered major upheaval

Thursday, March 21, 2013

World Water Day 2013: Water Cooperation

In 1993 the United Nations General Assembly declared 22 of March as the "World Water Day", as a means of focusing attention on the importance of freshwater and advocating for the sustainable management of freshwater resources. Since then, every 22 of March "World Water Day" was celebrated around the world, focusing on different topics each year.

2013 "World Water Day" will be celebrated under the theme Water Cooperation, within the framework of the International Year of Water Cooperation 2013, coordinated by UNESCO on behalf of UN Water. During the Water Cooperation 2013 Campaign, which includes the Year and the Day, efforts around the world at local, national and international levels will help to raise awareness on the potential and challenges for water cooperation, facilitate dialogue among actors, and promote innovative solutions for nurturing water cooperation.
Image 1. World Water Day 2013 logo

A high point of the Campaign will be the official World Water Day celebrations hosted by the Government of The Netherlands on 22 March 2013 in The Hague. Within the limit of capacity constraints, as wide a variety as possible of key stakeholders from inside and outside the ‘water box’ have been invited.

Water cooperation is a foundation for peace and sustainable development. Water cooperation contributes to poverty reduction and equity, creates economic benefits, helps preserve water resources and protect the environment, and builds peace.

The following video shares the Video Message from UN Secretary-General Ban Ki-moon on the importance of Water Cooperation, the theme of World Water Day 2013.

Additional reading:
UN World Water Day
UN World Water Day 2013
United Nations General Assembly Resolution 193 session 47

Not even Superman could have stopped Russian Meteorite

We still remember that last February 15, 2013, a meteorite hit the Russian Ural's near the city of Chelyabinsk. Several persons were injured, several building were damaged, and services such as internet, mobile, gas or electricity were interrupted  Such event revived speculations about a possible apocalyptic meteorite event. For instance, NASA announced that it has neither the funding to launch an infrared-sensing telescope in space to detect asteroids such as the one that blew up without warning over Russia last month, nor the capability to blast them out of the sky. When asked what would happen if we discovered one three weeks away from an impact with the earth, NASA's administrator Charlie Bolden answered: "The answer to you is, if it's coming in three weeks, pray." 

The other day I found a nice article about a fictional press conference given by Superman, in which he explains why he did nothing about the russian meteorite. I considered it very illustrative about the difficulties of preventing a meteorite hit.

Deviate it towards the Sun? 
First, is important to remember that Scientists could not detect the Russian meteorite because it came out of the daytime sky. Such kind of asteroids are nearly impossible to find ahead of time because telescopes can only spot asteroids during the night. Hence, when the asteroid was detected it would have been impossible even for Superman to deviate it towards the sun. The only 2 possibilities were either slow it down or destroy it. 

Slow it down? 
We must consider that the meteor was clocked at a speed of 40,000 miles per hour. When entering the atmosphere the meteor experiences a kind of crash, since it changes a vacuum environment (space) to  gas fluid environment (atmosphere). In order for an asteroid to slow down, the atmosphere absorbs the asteroid's energy and emits it as heat and light. Attempting to slow it down would have just burned it up anyway. Moreover, it would have absorbed more energy in the same time. Hence, it is reasonable to assume that it would have generated more heat and a brighter explosion. 

Destroy it? 
At the speed the meteorite was going, it contained around 440 kilotons, which is about 20 times the atomic bomb that hit Nagasaki. The atmosphere absorbed most of the meteor's energy, with only the aftermath of the fireball doing damage to Chelyabinsk. Destroying the meteor would have released all his energy at once. That would have been much worse.
For better understanding the possible damage of destroying the meteorite, let's take "The Bluegill Triple Primesh" test explosion of 1962. Such test exploded 410 kilotons at an altitude of 31 miles above the Earth. Nuclear researchers at ground zero could feel the heat on the ground and two of them even got retinal burns Now, considering that when the meteorite exploded it had an altitude of just 15 miles above the Earth (half the altitude of The Bluegill Triple Primesh test), we can imagine what would have happened when exploding a bomb of the same size at only half the altitude above Chelyabinsk. 

Animation 1. Meteorite hits Russia

Additional reading:
Superman Explains Why He Didn’t Destroy the Russian Meteor
Here's Why Astronomers Did Not Detect The Russia Meteor Ahead Of Time
Asteroid heading for New York? You better pray, NASA chief tells US Congress

Sunday, March 17, 2013

Black Holes Factory?

In 2006 it was predicted that the world's most powerful particle accelerator, a.k.a. "Large Hadron Collider", would enable to create black holes. The Large Hadron Collider  is in an underground circular tunnel nearly 17 miles long at the world's largest physics laboratory, the "Conseil Europeen pour la Recherche Nucleaire" (CERN), near Geneva. At its maximum, each particle beam the collider fires will pack as much energy as a 400-ton train traveling at 120 mph. By smashing particles together and investigating the debris, scientists hope to help solve mysteries such as the origin of mass and why there is more matter than antimatter in the universe.

What is a black hole?
The basic idea of a black hole is simply an object whose gravity is so strong that light cannot escape from it. It is black because it does not reflect light, nor does its surface emit any light. For better understanding let's imagine the following example using Newton's law of physics.
The basic idea of a black hole is simply an object whose gravity is so strong that light cannot escape from it. It is black because it does not reflect light, nor does its surface emit any light. The basic ideas based on Newtons law had to be extenended when Albert Einstein completed his theory of general relativity, in order to include situations in which time and space could be greatly distorted.
The German mathematician Karl Schwarzschild investigated what would happen if all the matter in a body were concentrated at a mathematical point, and distinguished two black hole regions separated by a geometric feature called an “event horizon”. The world outside the event horizon is where we live and contains our universe, but inside the event horizon, space and time behave in very different ways entirely. Once inside, matter and light cannot get back out into the rest of the universe.
Figure 1. Artist's impression of a dust torus around a super-massive black hole. 

Missconception: Is black hole a vacuum cleaner?
Most people think of a black hole as a voracious vacuum cleaner in space, sucking down everything around it. But that's not really true. Black holes can only suck matter under certain conditions.
  • If a body orbits close to the event horizon in an elliptical orbit, it emits gravitational radiation, and its orbit will eventually decay in millions of years. 
  • A disk of gas can form around a black hole, and through friction, matter will slowly slide into the black hole over time
How to create black holes?
The most common way for a black hole to form is probably in a supernova, an exploding star. When a star with about 25 times the mass of the Sun ends its life, it explodes. The outer part of the star screams outward at high speed, but the inner part of the star, its core, collapses down. If there is enough mass, the gravity of the collapsing core will compress it so much that it can become a black hole. When it’s all over, the black hole will have a few times the mass of the Sun. This is called a “stellar-mass black hole”, what many astronomers think of as a “regular” black hole.
Black holes also form when two orbiting neutron stars merge to produce a short gammaray burst, a tremendous blast of energy detectable across the entire observable Universe.
Using supercomputers researchers were able to simulate collisions among particles zipping near the speed of light. Such simulations have shown that black holes could form at lower energies than previously thought.
According to Einstein's theory of relativity mass and energy are related. The greater the energy of a particle, i.e., the faster a particle gets accelerated in a collider, the greater its mass becomes. Next, Einstein's theory explains that mass curves the fabric of space and time, generating the phenomenon known as gravity. As particles zip along within particle colliders, they warp space-time and can focus energy much as glass lenses focus light. When two particles accelerated are at each other, they distort to pancake shapes and then form a black hole, as shown in video 1. 

Video 1. Two particles accelerated at each other distort to pancake shapes and then form a black hole
Source: www.livescience.com/

The following video summarizes a first introduction about black holes.

Video 2. Black Holes:Warping Time & Space.
Source: www.space.com

Additional Reading:
Space Math: Black Holes
Black Holes
Despite Rumors, Black Hole Factory Will Not Destroy Earth
Mini Black Holes Easier To Make Than Thought

Thursday, March 14, 2013

Garbage Patch in the Oceans

One of the problems of not considering the territorial distribution based on basins, is that we create the idea that we can solve problems by getting rid of them. For instance, we clean by throwing garbage (e.g. a plastic bottle or drinking straw) to the river without considering the effects downstream. Our location may be clean, but we just passed the problem (garbage) to the ones downstream. Something like sweep under the carpet.

I chose the example of plastic objects, since they are the main component of a big environmental problem in the oceans known as "garbage patches". Garbage patches are large oceanic areas where the currents concentrate marine debris. All the combined trash from sewer, solid waste, landfills and trash discarded in the street eventually ends up in the ocean. As material is captured in the currents, wind-driven surface currents gradually move floating debris toward the center the patches, trapping them in the region.
Figure 1. Example of marine debris

It is important to note that some missunderstood was created by using the term of "garbage continent". Actually, the patches are not visible as they consist of very small pieces with low density. Hence, they are suspended beneath the surface of the ocean.

Where are they located?
The major garbage patches are located in eastern and western Pacific patches. Recently, new garbage patches were reported in the North Atlantic and the Indian Ocean. Model simulation predicted the future existence of 5 potential patches as showed in the figure, and described in the table.


Figure 2. Location of potential garbage patches

Table 1. Characteristics of the potential garbage patches
Patch name Eastern Garbage Patch Western Garbage Patch Northern Garbage Patch Southern Garbage Patch Indian Garbage Patch
Location Pacific Ocean Pacific Ocean Atlantic Ocean Atlantic Ocean Indian Ocean
Surface [km^2] 8095000 715520 3625753 1296180 2183480

Is there a solution?
Unfortunately, there is no fast and easy solution. Cleaning? The time and cost of cleaning make that alternative an unfeasible one. Moreover, it is not a solution, since eventually the garbage will return to the sea and the problem will persist.

The solution consists on 4 concepts. Prevention, reduction, management and education.
Be conscious of plastics that you use and dispose of. Even the smallest pieces of plastic can pose a threat to the health of marine and animals and our planet. Try using reusable water bottles and shopping bags. Also try using products with less packaging and avoid single use plastics. The more we reduce plastics consumption, the cleaner we can keep our oceans.

Additional Reading:
Plastic Debris in the Ocean
The Garbage Patch in the Oceans: The problem and possible solutions
What we know about: The garbage patches
Huge garbage patch found in Atlntic too
New ocean garbage patch discovered
Help put a stop to ocean garbage patches
Garbage patch in lakes

Wednesday, March 13, 2013

Satellite detected Japan's 2011 earthquake and tsunami

Last March 11 the world remembered the earthquake and tsunami that hit Japan on 11 March 2011. New studies have revealed that this massive quake was also felt in space by ESA's satellite GOCE (Gravity field and steady-state Ocean Circulation Explorer).
GOCE was launched in 2009 with the main objective of mapping Earth's gravity, the fundamental force that pulls mass. In order to achieve its very challenging mission objectives, this slender, five-metre long satellite is designed to orbit at a very low altitude of just 260 km because the gravitational variations are stronger closer to Earth.
The following video provides more information about GOCE and gravity.
Earthquakes not only create seismic waves that travel through Earth’s interior, but large quakes also cause the surface of the planet to vibrate like a drum. This produces sound waves that travel upwards through the atmosphere.
Scientists from the Research Institute in Astrophysics and Planetology in France, the French space agency CNES, the Institute of Earth Physics of Paris and Delft University of Technology in the Netherlands, supported by ESA’s Earth Observation Support to Science Element, have discovered that GOCE detected sound waves from the massive earthquake that hit Japan on 11 March 2011. When GOCE passed through these waves, its accelerometers sensed the vertical displacements of the surrounding atmosphere in a way similar to seismometers on the surface of Earth. Wave-like variations in air density were also observed.
GOCE opens a door that will allow to understand our planet by looking up to the space.
The following animation shows how the massive earthquake that hit Japan in 2011 caused ripples in the atmosphere. As sound waves from the earthquake travelled upwards, they caused changes in air density that were detected by ESA’s GOCE gravity satellite as it crossed the wavefront.
Loading...

Additional reading:
GOCE: The first seismometer in orbir OCE/GOCE_the_first_seismometer_in_orbit
GOCE feels quake
GOCE

Thursday, February 7, 2013

Solar Wind

The solar wind is a stream of charged particles released from the upper atmosphere of the Sun. It mostly consists of electrons and protons. The source of the solar wind is the Sun's hot corona. The temperature of the corona is so high that the Sun's gravity cannot hold on to it. The solar wind speed varies between 300 km/s and 800 km/s. These high and low speed streams interact with each other and alternately pass by the Earth as the Sun rotates.

As the solar wind approaches a planet that has a well-developed magnetic field, e.g. the Earth, Jupiter and Saturn, the particles are deflected by the Lorentz force. This region is known as the magnetosphere and it causes the particles to travel around the planet rather than bombarding the atmosphere or surface. The magnetosphere is roughly shaped like a hemisphere on the side facing the Sun, then is drawn out in a long wake on the opposite side. Earth itself is largely protected from the solar wind by its magnetic field, which deflects most of the charged particles. A smaller number of particles from the solar wind manage to travel to the Earth's upper atmosphere and ionosphere in the auroral zones. That produces phenomena such as the aurora and geomagnetic storms. 
 Image source: weirwarpd

Astral bodies without magnetic field, e.g. the comets, are not able to deflect the solar wind; therefore, they have long tails pointing opposite to the sun. Venus, the nearest and most similar planet to Earth in the Solar System, has an atmosphere 100 times denser than our own, with little or no geo-magnetic field; hence, ia has a comet-like tail that extends to the orbit of the Earth. 

Additional reading:
Solar Physics: The Solar Wind
Solar Wind in Wikipedia

Monday, February 4, 2013

Energy Consumption and Global Warming

The earth at night. This photo collage made with more than 400 superimposed remote sensing images shows the whole planet during the night. It got my attention the light from the big cities, most of them in the northern hemisphere. I got surprised by the bright color and the tried to imagine the energy consumed.
By 2006 it was estimated that the worldwide energy consumption was about 498 exajoules. This anthropogenic heating may affect the circulation pattern and the surface air temperature. Actually, a research recently published at the NAture Climate Change showed that including energy into climate models leads to remote temperature changes. Such study concluded that energy consumption is probably a missing forcing for the winter warming trends.

Photo source: Der Spiegel
Additional reading:
Energy consumption and the unexpected winter warming over Asia and North America
Satellitenbild der woche: Wo des Nachts die Lichter brennen