Oroville dam disaster observed by satellite images
Last days we had several news about the Oroville dam. In
this post I will not describe the details of this natural disaster because
there are already several sites about that that. Instead, I prefer to provide a
visualization of this disaster so that we can understand its magnitude and
visualize it. For such purpose I used remote sensing satellite data collected before
the disaster and during the disaster. In all the images you can get a full screen image by clicking the image.
Satellite images of Orville dam disaster
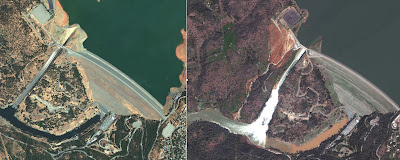
The figure shows 2 images observed by the French satellite Spot. The left images was observed on November 11, 2016 (before the disaster), while the right image was observed on February 14, 2017 (during the disaster). The water changes are evident. Before the event we easily visualize the shoreline. Besides, we can also visualize 2 details during the event (right image). A) At the dam we can see a white spot which the water over the spillway, and B) the water in the reach between the dam and Oroville city has different colours because of the mud and earth;
Fig 1. Spot image of Oroville dam before the event (left) and during the event (right) Click the image for full screen image
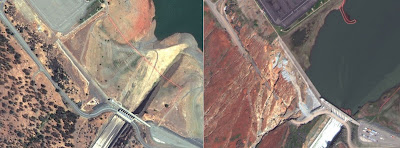
Thanks to Digital Globe, ESA and Gizmodo, we can visualize in more detail what really happened in the auxiliary spillway. The left image shows the
spillway before the event, while the right image shows the spillway during the
event. We can observe the spillway at full capacity and the auxiliary spillway
already collapsed.
Fig 2. Image of Oroville spillway before the event (left) and during the event (right) (Source: Digital Globe, Gizmodo). Click the image for full screen image
Fig 3. Image of Oroville spillway before the event (left) and during the event (right) (Source: Digital Globe, Gizmodo). Click the image for full screen image
A spanish version of this post was published at iAgua
A spanish version of this post was published at iAgua


No comments
Post a Comment